title: K GraphFuse vs NVIDIA cuGraph — benchmark results and accuracy description: Audited direct comparisons: 66.3% of 89 attempted native-cuGraph cases pass the speed gate, 29.2% also pass both error checks, with raw timings, failures, and workflow limits.
Native cuGraph comparison
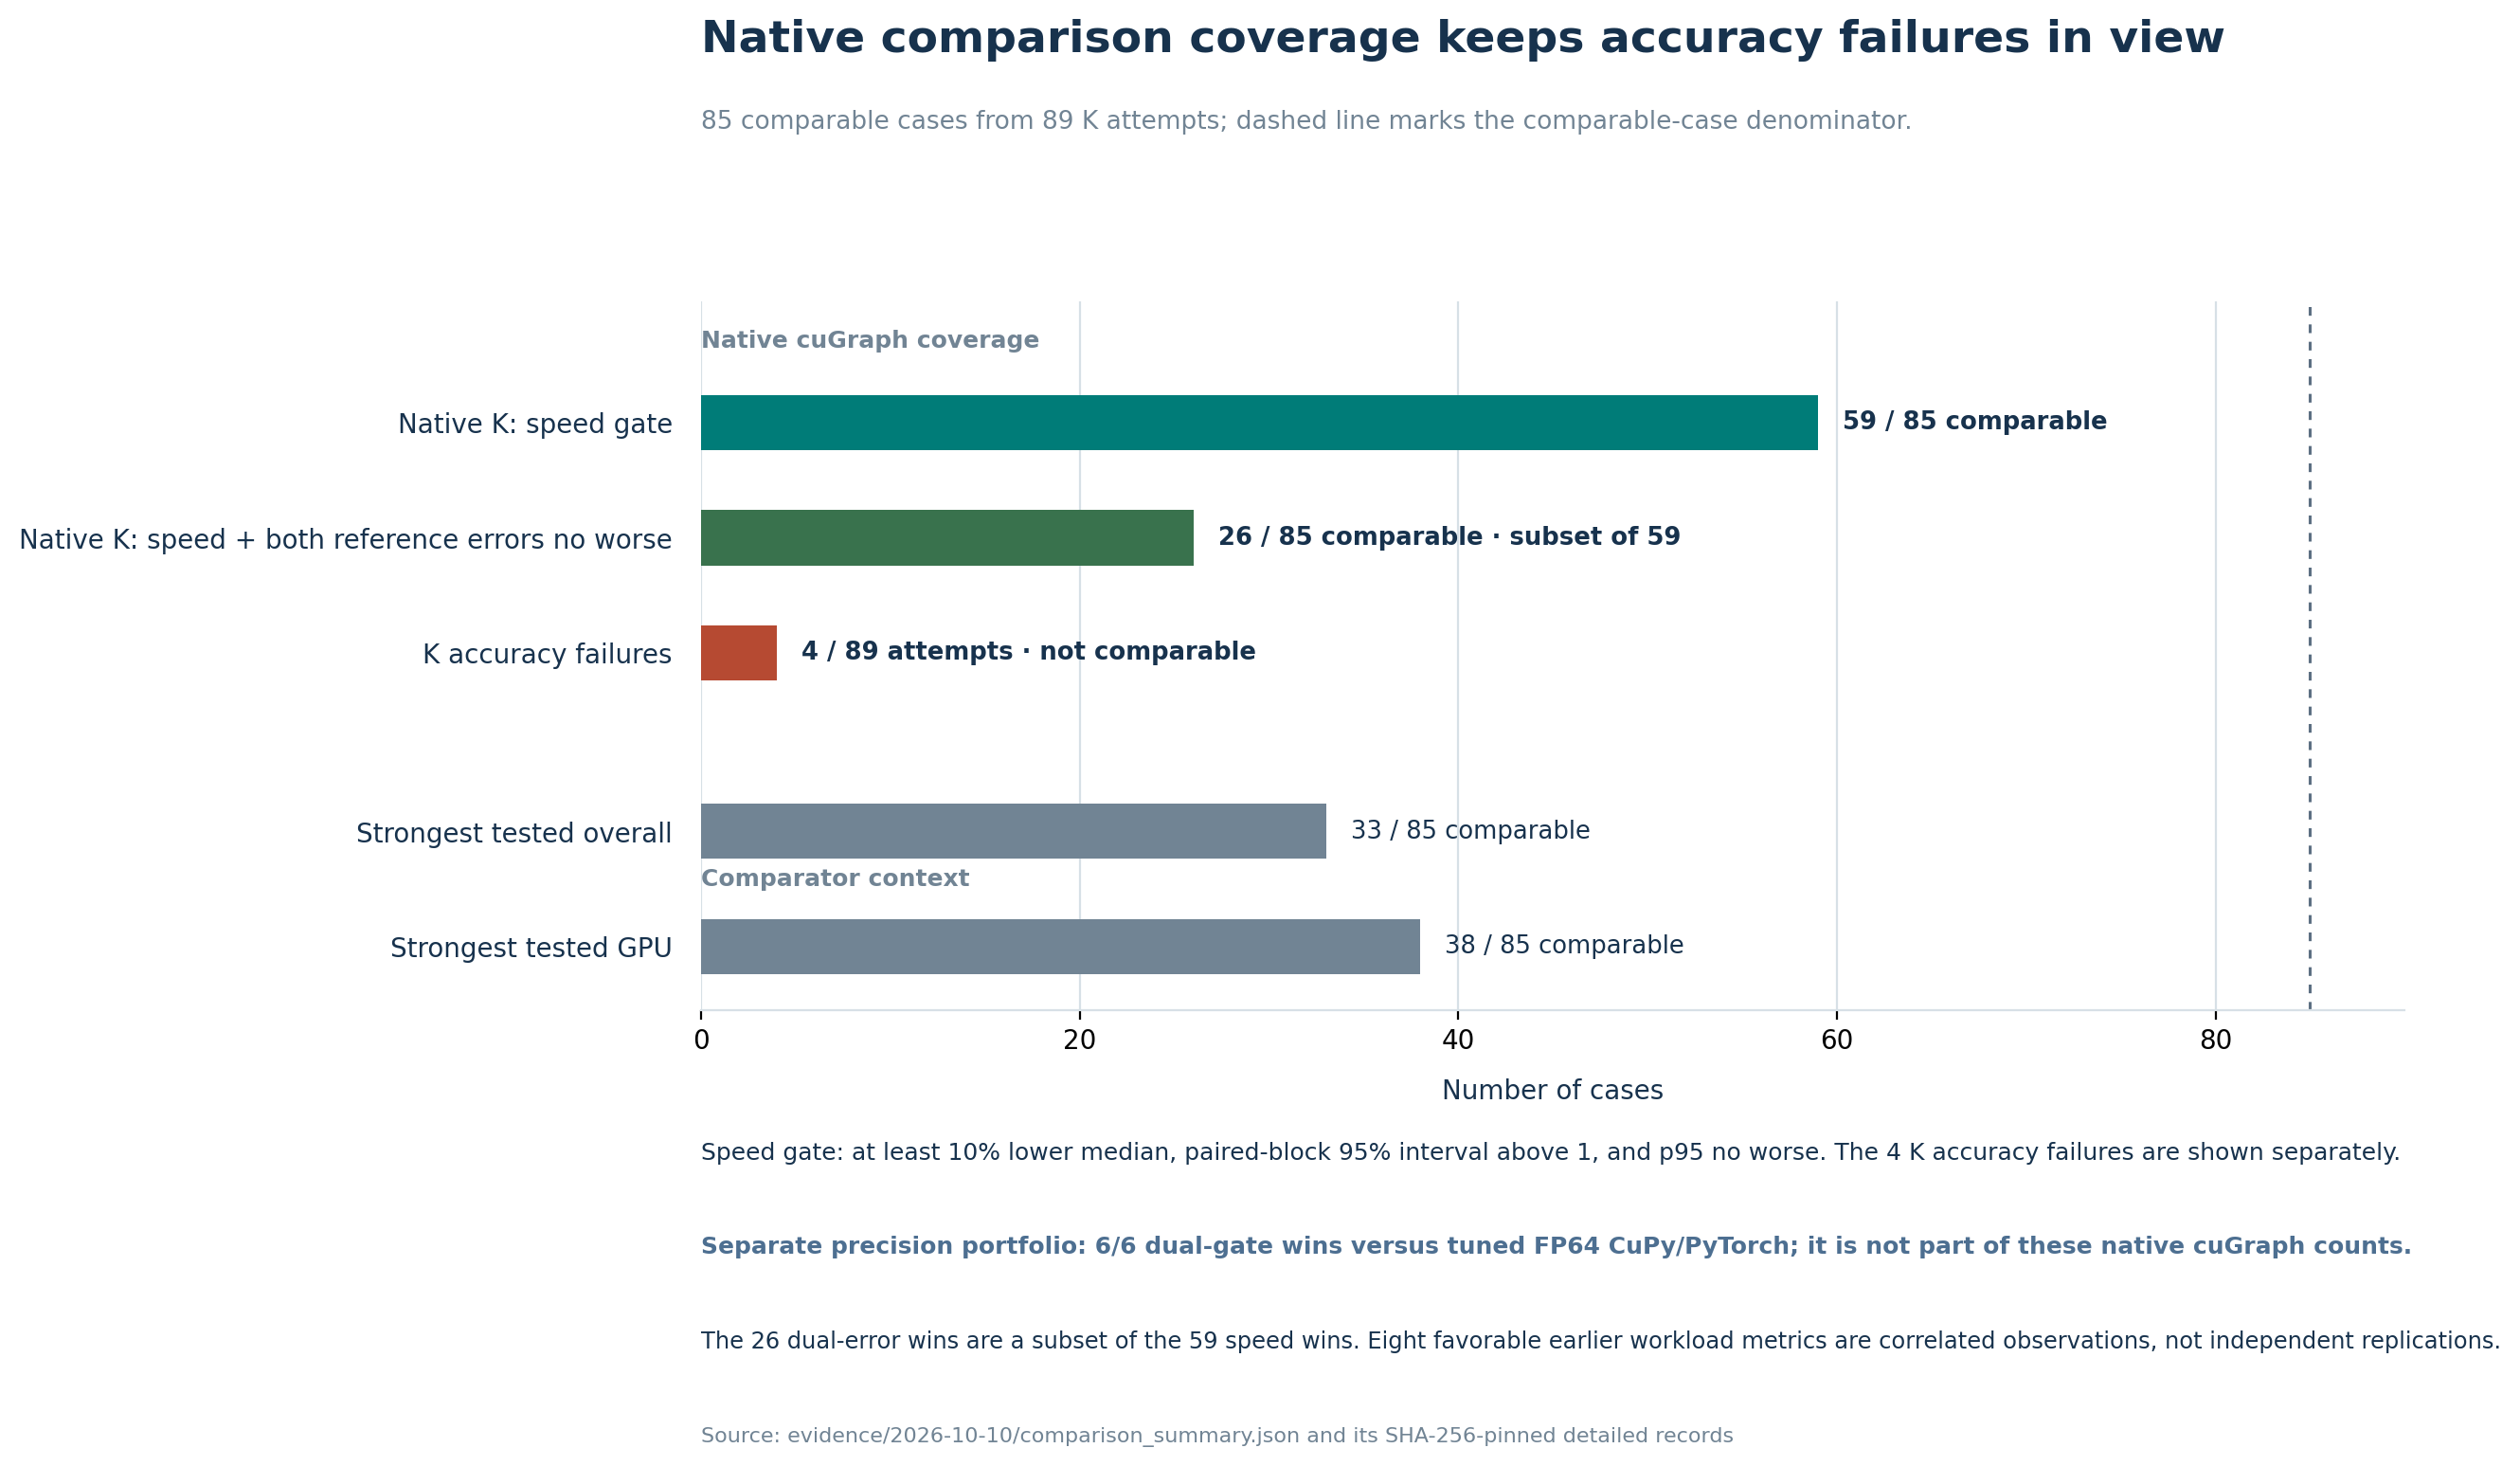
K GraphFuse passes the recorded strong speed gate in 59 of 89 attempted native-cuGraph cases (66.3%), or 69.4% of the 85 directly comparable cases. In 26 of 89 attempts (29.2%; 30.6% of comparable cases), it also has no worse aggregate L1 or maximum-relative reference error. The attempted-case denominator includes four cases in which K did not produce an accepted accuracy confirmation; all four are non-wins.
This page describes the 15-suite ranking study. The precision GPU experiment evaluates a different source version and mathematical workload against FP64 CuPy/PyTorch. Do not pool their wins.
Results at a glance
| Measure | Result | Interpretation |
|---|---|---|
| Native-control cases attempted | 89 | 85 directly comparable plus four K accuracy failures |
| Lower K median latency | 76.5% (65/85) | Descriptive timing advantage |
| Strong K speed gate | 69.4% (59/85) | At least 10% lower median, confidence interval above one, p95 no worse |
| Both reference errors no worse | 55.3% (47/85) | Aggregate L1 and worst relative per-vertex errors |
| Strong speed gate and both errors no worse | 30.6% (26/85) | More restrictive measured advantage |
| Speed wins including accuracy failures | 59/89 (66.3%) | Four failures are non-wins |
| Speed-and-error wins including failures | 26/89 (29.2%) | Does not include unmeasured energy or memory |
| Same-precision subset | 76 cases; 67.1% (51/76) speed wins | Nine direct comparisons selected different precisions |
All 26 speed-and-error wins are in the same-precision subset. Compared configurations independently tune precision, coefficient packing, capture, approximation and native convergence settings where applicable. Acceptance matches the recorded task and error budgets; an accepted faster FP32 output is not an FP64 accuracy-equivalence claim.
Compare against the strongest tested alternative
| Comparator set | Strong speed-gate passes |
|---|---|
| Native cuGraph | 69.4% (59/85 comparable cases) |
| Fastest tested GPU control | 44.7% (38/85) |
| Fastest tested overall control, including CPU where measured | 38.8% (33/85) |
A native cuGraph win can coexist with a faster CuPy or SciPy implementation. CPU measurements follow the declared size limit; unmeasured CPU paths are not assumed slower. These are the strongest tested controls, not an exhaustive world-wide SOTA catalogue.
Results by suite
| Suite | Comparable native cases | Strong speed wins |
|---|---|---|
convergence |
14 | 4 |
directed-fixed |
12 | 12 |
dynamic-rebuild |
1 | 1 |
file-workflows |
1 | 1 |
graphalytics |
2 | 0 |
hard-graphs |
15 | 13 |
independent-repeat |
4 | 3 |
locality |
6 | 6 |
precision-weights |
13 | 3 |
public-snap |
10 | 10 |
scale-density |
7 | 6 |
The file-workflows and dynamic-rebuild rows above measure their resident ranking component. Complete workflow measurements below have a different outcome. Four additional failures occur in public personalized rankings and wide-range weighted precision cases; their records remain published.
Selected public graphs
These are compute-stage measurements with accepted outputs. Here s = native median / K median; K compute-time reduction is 100 × (1 − 1/s), and the derived reciprocal-latency serial compute-rate increase is 100 × (s − 1). The last column is calculated from isolated median latency, not concurrent throughput. Medians are shown beside percentages to expose the comparison baseline.
| Graph and contract | K median ms | Native baseline ms | s (native/K) |
Median compute time lower | Derived serial rate higher | Strongest recorded alternative |
|---|---|---|---|---|---|---|
| facebook_combined, ten updates | 0.617 | 1.700 | 2.755x | 63.7% | 175.5% | K also passes fastest CuPy: 1.366/0.617 ms, s=2.215x, 54.9% less time, 121.5% higher derived rate |
| web-Google, ten updates | 7.548 | 14.453 | 1.915x | 47.8% | 91.5% | CuPy remains faster than K |
| com-dblp, ten updates | 2.005 | 5.726 | 2.856x | 65.0% | 185.6% | CuPy remains faster than K |
| com-youtube, ten updates | 7.124 | 16.233 | 2.279x | 56.1% | 127.9% | CuPy remains faster than K |
| roadNet-CA, ten updates | 7.390 | 20.985 | 2.839x | 64.8% | 184.0% | CuPy remains faster than K |
The corresponding potential applications are centrality refresh workers, link/citation scoring and graph-feature stages. Network importance on roadNet is not shortest-path routing. Ranking latency does not establish downstream retrieval, fraud or recommendation quality.
Original matched-workload resource measurements
The original same-T4 reference experiment measured ten global PageRank updates on datagen-7_5-fb: 633,432 vertices, 34,185,747 source edges, uniform initialization and damping 0.85. Both selected implementations used FP32 and passed the official per-vertex reference check.
| Metric, lower is better | K GraphFuse | Native cuGraph baseline | Observed difference |
|---|---|---|---|
| Warm compute median | 49.906 ms | 63.398 ms | 21.28% less median time; s=1.2703x; 27.03% higher derived serial rate |
| Warm p95 latency | 49.983 ms | 67.156 ms | p95 latency was 25.57% lower; p95 is not a median-derived rate |
| Compute + host output median | 50.422 ms | 63.466 ms | 20.55% less median time; s=1.2587x; 25.87% higher derived serial rate |
| Compute + host output p95 latency | 51.359 ms | 68.483 ms | p95 latency was 25.01% lower; p95 is not a median-derived rate |
| First execution after GPU preparation | 61.941 ms | 70.695 ms | 12.38% less time; s=1.1413x; 14.13% higher derived rate; one observation |
| Sampled total GPU peak | 1.285 GB | 2.971 GB | K 56.76% lower |
| Sampled process RSS peak | 4.920 GB | 7.672 GB | K 35.87% lower |
| Worst relative per-vertex error | 2.521e-7 | 4.527e-7 | K 44.32% lower |
| Aggregate L1 error | 4.903e-8 | 4.498e-8 | K 9.01% higher |
Eight of these nine observations favor K. They are correlated measurements of one setup. GB is decimal. GPU/process memory includes inherited/library allocations, sampled every 20 ms; short peaks can be missed. Preparation scopes differ and are excluded from this count. Sampled board power was higher for K, 59.576 vs 41.844 W; integrated query energy was not measured.
A later 155-sample confirmation of this graph measured K 56.089 ms vs native 54.667 ms. The original 21.28% result therefore cannot serve as an unconditional or replicated speed advantage.
Negative results and unsupported tasks
| Task | K median | Native baseline median | s (native/K) |
K median-time reduction | K derived serial-rate change | Outcome |
|---|---|---|---|---|---|---|
| Graph500-22 ten-update ranking | 435.741 ms | 160.189 ms | 0.368x | −172.0% (K took 172.0% more time) | −63.2% | Native reciprocal-median rate was 2.72x K’s |
| Later datagen confirmation | 56.089 ms | 54.667 ms | 0.975x | −2.6% (K took 2.6% more time) | −2.5% | Native slightly faster |
| File import through saved scores | 42.034 ms | 23.552 ms | 0.560x | −78.5% (K took 78.5% more time) | −44.0% | Native full workflow faster |
| Changing graph, rebuild through host output | 21.458 ms | 12.737 ms | 0.594x | −68.5% (K took 68.5% more time) | −40.6% | Native full workflow faster |
| BFS, shortest paths, components, triangles and Louvain | Not implemented in K | Native baselines recorded | — | — | — | No K win |
For these signed changes, a negative time reduction means K took longer; a negative derived-rate change means lower reciprocal-median rate. Complete-workflow rows are fixed-configuration diagnostics, without the held-out selection or confidence protocol of the resident study. They establish measured outcomes on those workflows, not every possible integration.
Measurement and reproducibility
The complete study contains 15 suites, 111 case records and 2,190 candidate configurations. All 104 predeclared ranking/filter cases have records. Selected resident backends use five confirmation blocks of 31 synchronized samples. Pilot samples are excluded from final timings. The broad-suite interval resamples whole paired blocks and recomputes pooled median ratios. The strong speed gate requires K_median <= 0.9 * comparator_median, interval lower endpoint above one and K p95 no worse.
The stricter error screen compares the worst recorded block L1 and maximum-relative errors. It uses a rounded reference; this is a different oracle from the sampled high-precision precision study. The recollection of counts is not a new performance execution. Independent runs, hardware diversity and production workflows remain necessary for broader claims.
Evidence files
- All 85 direct comparisons, including losses
- Four K accuracy failures
- Audited comparison counts and source hashes
- All confirmed competitors
- Complete configuration search
- Full workflow diagnostics
Run python benchmarks/verify_evidence.py from a repository checkout. See methodology, reproduction, and application fit.
Separate theorem-bound evidence
The old/new-bound attribution compares the same FP64 PyTorch backend with different complete-bound constants. Its eight 3.56–5.35% observed timing reductions occur in two degree-changing records out of eleven examined matrix/sensitivity workloads. These are not native-cuGraph comparisons, do not pass the separate 10% strong-speed bar and add no native wins.